Market Outlook
September 26, 2016
Market Cues
Domestic Indices
Chg (%)
(Pts)
(Close)
Indian markets are likely to open on a negative note considering global cues.
BSE Sensex
(0.4)
(105)
28,668
Nifty
(0.4)
(36)
8,832
U.S. stocks closed near session lows on Friday, as investor sentiment to a hit over
Mid Cap
0.3
37
13,332
reports that major oil producers are not likely to reach an agreement to freeze
Small Cap
0.1
10
12,959
production at a meeting this weekend. This resulted in the largest one-day loss for
oil futures since mid-July. The energy sector tumbled 1.3% leading losses in the
Bankex
(1.2)
(283)
22,753
large-cap benchmark. Among the internet space, shares of Twitter soared 22% amid
intensifying talk of a takeover either by Salesforce.com Inc. or Alphabet Inc.
Global Indices
Chg (%)
(Pts)
(Close)
U.K. stocks inched lower on Friday as some miners and financials lost ground. The
Dow Jones
(0.7)
(131)
18,261
FTSE 100 index UKX, -0.03% dipped by less than 0.1% to end at 6,909.43, but that
Nasdaq
(0.6)
(34)
5,306
still left the blue-chip benchmark up 3% for the week. Miners also were among the
FTSE
(0.0)
(2)
6,909
day’s notable losers, after mostly gaining Thursday when a weaker dollar boosted
Nikkei
(0.3)
(54)
16,754
metals prices. Energy stocks bounced back from early losses to finish higher.
Hang Seng
(0.3)
(73)
23,686
The Indian markets ended lower on Friday over profit booking For the week
Shanghai Com
(0.3)
(8)
3,034
however, indices still ended up posting weekly gains. Due to the expiry, market may
show some volatility this week.
Advances / Declines
BSE
NSE
News Analysis
Advances
1,153
619
Maruti launches Alto special edition dedicated to MS Dhoni
Declines
1,534
998
L&T Shipbuilding eyes `9,000cr orders in 3 years, mostly from Navy
Unchanged
248
77
Detailed analysis on Pg2
Investor’s Ready Reckoner
Volumes (` Cr)
Key Domestic & Global Indicators
BSE
3,872
Stock Watch: Latest investment recommendations on 150+ stocks
NSE
24,625
Refer Pg5 onwards
Net Inflows (` Cr)
Net
Mtd
Ytd
Top Picks
CMP
Target
Upside
FII
402
4,720
45,389
Company
Sector
Rating
(`)
(`)
(%)
MFs
327
970
11,079
Amara Raja Batteries Auto & Auto Ancillary Accumulate
1,022
1,174
14.9
HCL Tech
IT
Buy
798
1,000
25.3
Bharat Electronics
Capital Goods
Accumulate
1,261
1,414
12.1
Top Gainers
Price (`)
Chg (%)
Equitas Holdings
Financials
Buy
181
235
29.6
Srf
1,789
10.2
Navkar Corporation Others
Buy
193
265
37.4
Amtekauto
49
6.6
More Top Picks on Pg3
Prestige
218
6.5
Key Upcoming Events
Piind
862
4.8
Previous
Consensus
Date
Region
Event Description
Irb
261
4.6
Reading
Expectations
Sep 26 US
Consumer Confidence
101.1
98.5
Sep 27 US
New home sales
654.0
580.0
Top Losers
Price (`)
Chg (%)
Sep 29 US
Initial Jobless claims
252.0
--
Axisbank
557
(5.8)
Sep 29 Germany
Unemployment Change (000s)
(7.0)
(5.0)
Marksans
48
(5.2)
Sep 29 US
GDP QoQ (annualized)
1.1
1.3
Gvkpil
7
(4.3)
Sep 29 Euro Zone
Euro Zone Consumer Confidence
(8.2)
(8.2)
J&Kbank
80
(3.1)
Sep 30 UK
GDP YoY
2.2
2.2
6.(
More Events on Pg4
Muthootfin
372
(3.1)
Market Outlook
September 26, 2016
News Analysis
Maruti launches Alto special edition dedicated to MS Dhoni
Maruti Suzuki announced a special edition of its car Alto in the name of Indian
cricketer M S Dhoni coinciding with his upcoming multi lingual biopic. Dhoni along
with Maruti Suzuki executive director R S Kalsi unveiled the special editions of Alto
800 and Alto K10 at an event in Hyderabad on Saturday.
Alto's association with 'MS Dhoni-The Untold Story' is based on the cricketer's
massive popularity which harmonizes with the credibility of Alto in India, the
company said.
The special edition Alto has Dhoni inspired seat covers with number '7', Dhoni's
signature decal and body graphics, high-end music system, reverse parking
censors among other features, the company said.
This edition is available in Alto(Lxi), Alto K10(Lxi, Vxi) variants. It is offered with a
choice of two colour interior combinations-Black plus Silver and Red plus Blue. The
cars with these additional features are offered at an additional price of `16,777
and `12,777 depending on the variants. These cars will be made available at
dealership points from the first week of October, 2016, according to statement.
L&T Shipbuilding eyes `9,000cr orders in 3 years, mostly from
Navy
L&T Shipbuilding, part of Larsen & Toubro (L&T), is eyeing around `9,000cr orders
over the next three years, mostly from the Navy. L&T forayed into shipbuilding
earlier this decade and is yet to make money in the segment. The company has
two facilities, one at Kattupalli and second at Hazira in Gujarat.
There was a slowdown in the shipbuilding industry for some time both in
commercial and defense sectors however with the opening of the defense sector to
private players, there is a huge opportunity and company is expecting to bag a
sizeable amount of orders to be awarded by the Navy in the coming years.
The government's focus on improving national security and ring-fence the Indian
Ocean Region is expected to drive growth in the sector. L&T is expecting to bag
orders worth `9,000cr over the next 3 years and revenues to the tune of `3,000cr.
over the next three years. The company is also expecting to bag one contract to
develop amphibious assault ships, also called landing platform docks (LPD).
Economic and Political News
Finance Ministry may talk to EC before finalising Budget date
GDP growth to top 8% on rains, reforms
Private power producers struggle to meet emission deadline
Corporate News
L&T Tech lists at 7% premium, trims gains to end 1% higher
ONGC Board approves pact to take stake in GSPC gas block
Market Outlook
September 26, 2016
Top Picks ★★★★★
Large Cap
Market Cap
CMP
Target
Upside
Company
Rationale
(` Cr)
(`)
(`)
(%)
To outpace battery industry growth due to better technological
Amara Raja Batteries
17,457
1,022
1,174
14.9
products leading to market share gains in both the
automotive OEM and replacement segments.
Uptick in defense capex by government when coupled with
Bharat Electronics
30,272
1,261
1,414
12.1
BELs strong market positioning, indicate that good times are
ahead for BEL.
The stock is trading at attractive valuations and is factoring all
HCL Tech
1,12,550
798
1,000
25.3
the bad news.
Back on the growth trend, expect a long term growth of 14%
Infosys
2,39,571
1,043
1,370
31.4
to be a US$20bn in FY2020.
Source: Company, Angel Research
Mid Cap
Market Cap
CMP
Target
Upside
Company
Rationale
(` Cr)
(`)
(`)
(%)
Among the top 4 players in the consumer durables segment.
Bajaj Electricals
2,775
275
306
11.5
Improved profitability backed by turn around in E&P
segment. Strong order book lends earnings visibility.
Favourable outlook for the AC industry to augur well for
Cooling products business which is out pacing the market
Blue Star
5,145
540
578
7.1
growth. EMPPAC division's profitability to improve once
operating environment turns around.
With a focus on the low and medium income (LMI) consumer
Dewan Housing Finance
8,542
293
325
11.0
segment, the company has increased its presence in tier-II &
III cities where the growth opportunity is immense.
Strong loan growth backed by diversified loan portfolio and
adequate CAR. ROE & ROA likely to remain decent as risk of
Equitas Holdings
6,082
181
235
29.6
dilution remains low. Attractive valuations considering
growth.
Expectations of above average monsoon augurs well for
Goodyear India
1,458
632
684
8.2
Goodyear India as it derives ~50% of its turnover from farm
tyre segment.
Economic recovery to have favourable impact on advertising
& circulation revenue growth. Further, the acquisition of a
Jagran Prakashan
6,166
189
225
19.3
radio business (Radio City) would also boost the company's
revenue growth.
Speedier execution and speedier sales, strong revenue
Mahindra Lifespace
1,826
445
522
17.3
visibilty in short-to-long run, attractive valuations
Massive capacity expansion along with rail advantage at ICD
Navkar Corporation
2,750
193
265
37.4
as well CFS augurs well for the company
Earnings boost on back of stable material prices and
Radico Khaitan
1,483
112
125
12.1
favourable pricing environment. Valuation discount to peers
provides additional comfort
Strong brands and distribution network would boost growth
Siyaram Silk Mills
1,220
1,302
1,469
12.9
going ahead. Stock currently trades at an inexpensive
valuation.
Market leadership in Hindi news genre and no. 2 viewership
ranking in English news genre, exit from the radio business,
TV Today Network
1,864
312
363
16.2
and anticipated growth in ad spends by corporates to benefit
the stock.
Source: Company, Angel Research
Market Outlook
September 26, 2016
Key Upcoming Events
Global economic events release calendar
Date
Time
Country
Event Description
Unit
Period
Bloomberg Data
Last Reported Estimated
Sep 26, 2016
7:30PM
US
Consumer Confidence
S.A./ 1985=100
Sep
101.10
98.50
Sep 27, 2016
7:30PM
US
New home sales
Thousands
Aug
654.00
596.50
Sep 29, 2016
6:00PM
US
Initial Jobless claims
Thousands
Sep 24
252.00
--
6:00PM
US
GDP Qoq (Annualised)
% Change
2Q T
1.10
1.30
2:30PM
Euro Zone
Euro-Zone Consumer Confidence
Value
Sep F
(8.20)
(8.20)
1:25PM
Germany
Unemployment change (000's)
Thousands
Sep
(7.00)
(5.00)
Sep 30, 2016
2:00PM
UK
GDP (YoY)
% Change
2Q F
2.20
2.20
Oct 1, 2016
6:30AM
China
PMI Manufacturing
Value
Sep
50.40
50.50
Oct 3, 2016
2:00PM
UK
PMI Manufacturing
Value
Sep
53.30
--
Oct 4, 2016
11:00AM
India
RBI Reverse Repo rate
%
Oct 4
6.00
--
11:00AM
India
RBI Repo rate
%
Oct 4
6.50
--
11:00AM
India
RBI Cash Reserve ratio
%
Oct 4
4.00
--
Oct 7, 2016
2:00PM
UK
Industrial Production (YoY)
% Change
Aug
2.10
--
6:00PM
US
Change in Nonfarm payrolls
Thousands
Sep
151.00
173.00
6:00PM
US
Unnemployment rate
%
Sep
4.90
4.90
Oct 10, 2016
India
Exports YoY%
% Change
Sep
(0.30)
--
India
Imports YoY%
% Change
Sep
(14.09)
--
Oct 12, 2016
5:30PM
India
Industrial Production YoY
% Change
Aug
(2.40)
--
Oct 13, 2016
China
Exports YoY%
% Change
Sep
(2.80)
--
Oct 14, 2016
US
Producer Price Index (mom)
% Change
Sep
(0.30)
--
12:00PM
India
Monthly Wholesale Prices YoY%
% Change
Sep
3.74
--
7:00AM
China
Consumer Price Index (YoY)
% Change
Sep
1.30
--
Oct 17, 2016
2:30PM
Euro Zone
Euro-Zone CPI (YoY)
%
Sep F
0.20
--
6:45PM
US
Industrial Production
%
Sep
(0.43)
--
Oct 18, 2016
6:00PM
US
Consumer price index (mom)
% Change
Sep
0.20
--
6:00PM
US
Housing Starts
Thousands
Sep
1,142.00
--
Source: Bloomberg, Angel Research
Market Outlook
September 26, 2016
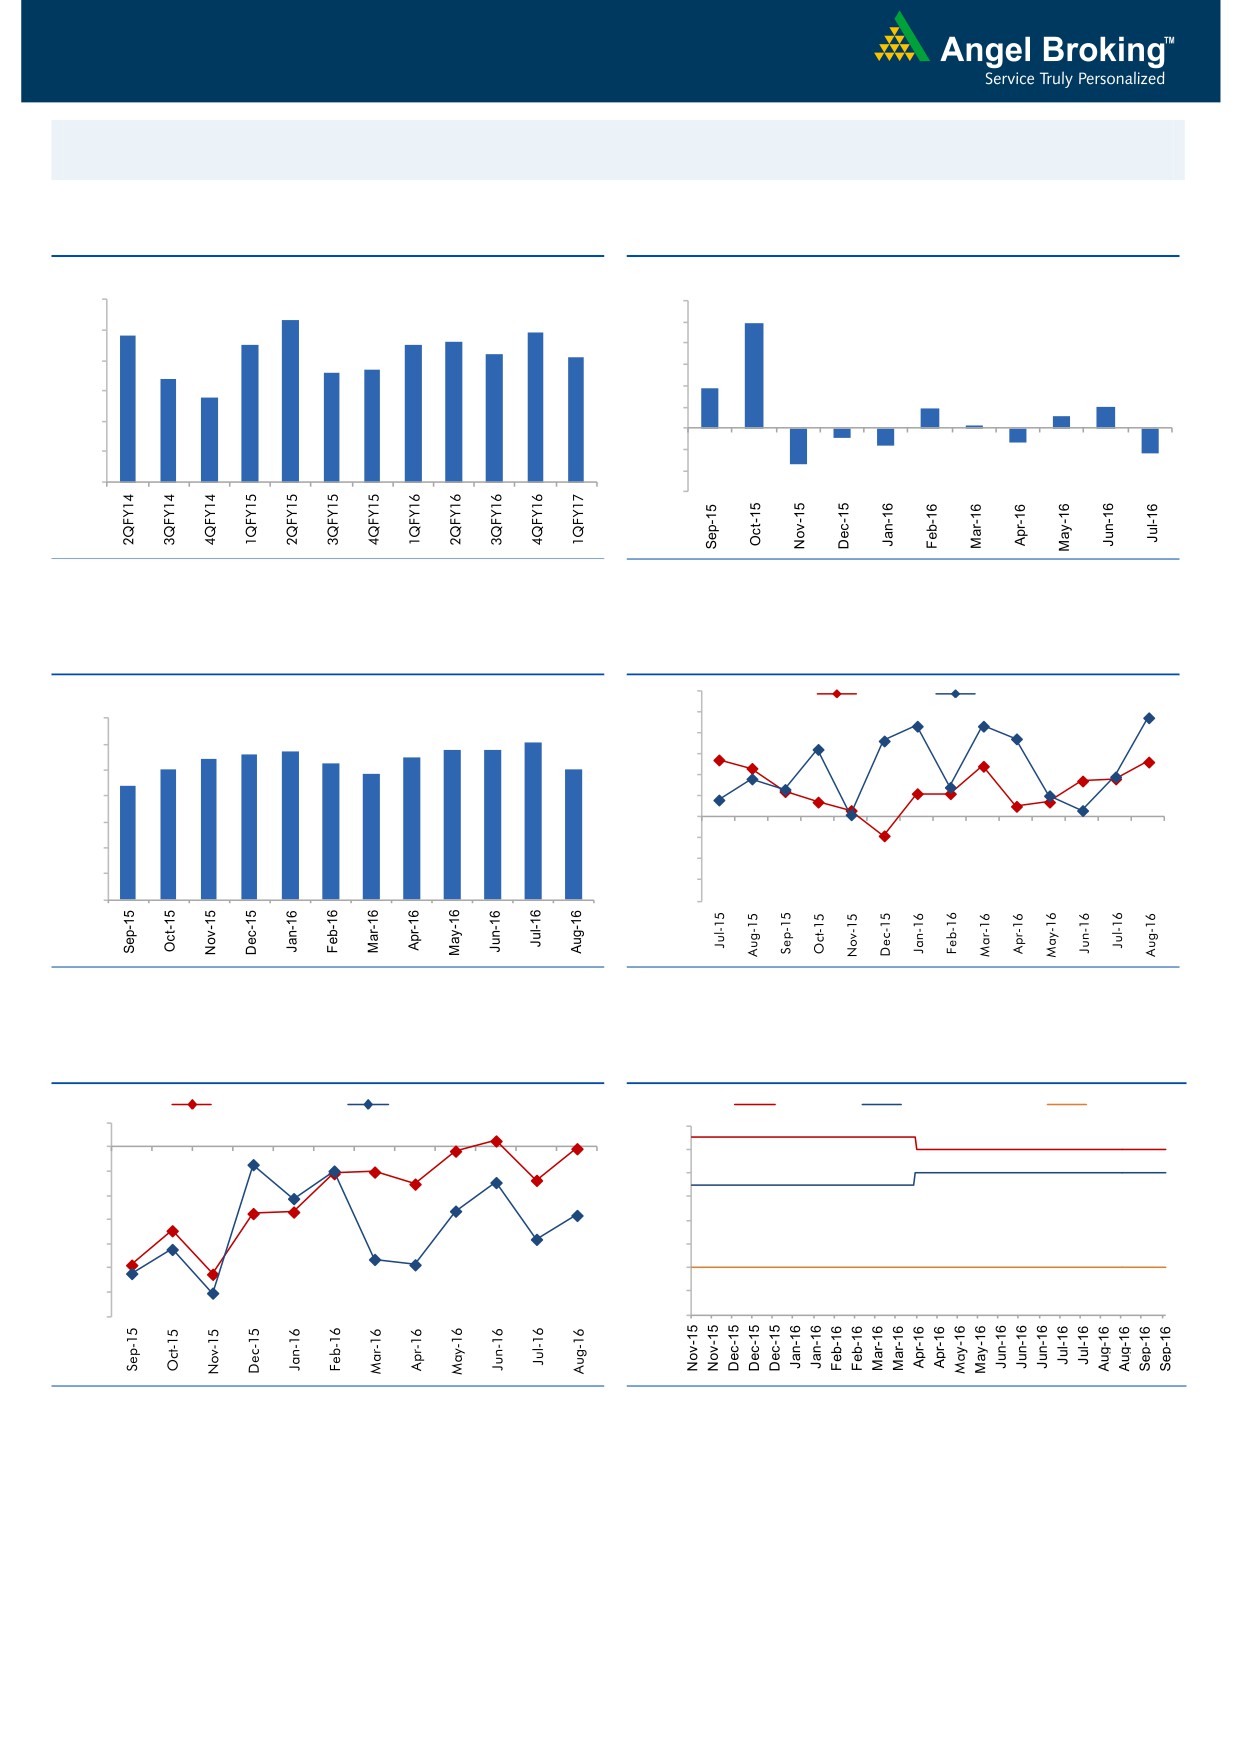
Macro watch
Exhibit 1: Quarterly GDP trends
Exhibit 2: IIP trends
(%)
(%)
9.0
12.0
8.3
9.9
7.8
7.9
8.0
7.5
7.5
7.6
10.0
7.2
7.1
8.0
6.6
6.7
7.0
6.4
6.0
3.7
5.8
6.0
4.0
1.9
2.0
1.1
2.0
0.3
5.0
-
4.0
(2.0)
(0.9)
(1.3)
(1.6)
(4.0)
(2.4)
3.0
(3.4)
(6.0)
Source: CSO, Angel Research
Source: MOSPI, Angel Research
Exhibit 3: Monthly CPI inflation trends
Exhibit 4: Manufacturing and services PMI
56.0
Mfg. PMI
Services PMI
(%)
55.0
7.0
6.1
5.7
5.8
5.8
54.0
6.0
5.4
5.6
5.5
5.0
5.3
5.1
53.0
4.8
5.0
4.4
52.0
4.0
51.0
50.0
3.0
49.0
2.0
48.0
1.0
47.0
-
46.0
Source: MOSPI, Angel Research
Source: Market, Angel Research; Note: Level above 50 indicates expansion
Exhibit 5: Exports and imports growth trends
Exhibit 6: Key policy rates
(%)
Exports yoy growth
Imports yoy growth
(%)
Repo rate
Reverse Repo rate
CRR
5.0
7.00
0.0
6.50
(5.0)
6.00
(10.0)
5.50
(15.0)
5.00
(20.0)
4.50
(25.0)
4.00
(30.0)
3.50
(35.0)
3.00
Source: Bloomberg, Angel Research
Source: RBI, Angel Research
Market Outlook
September 26, 2016
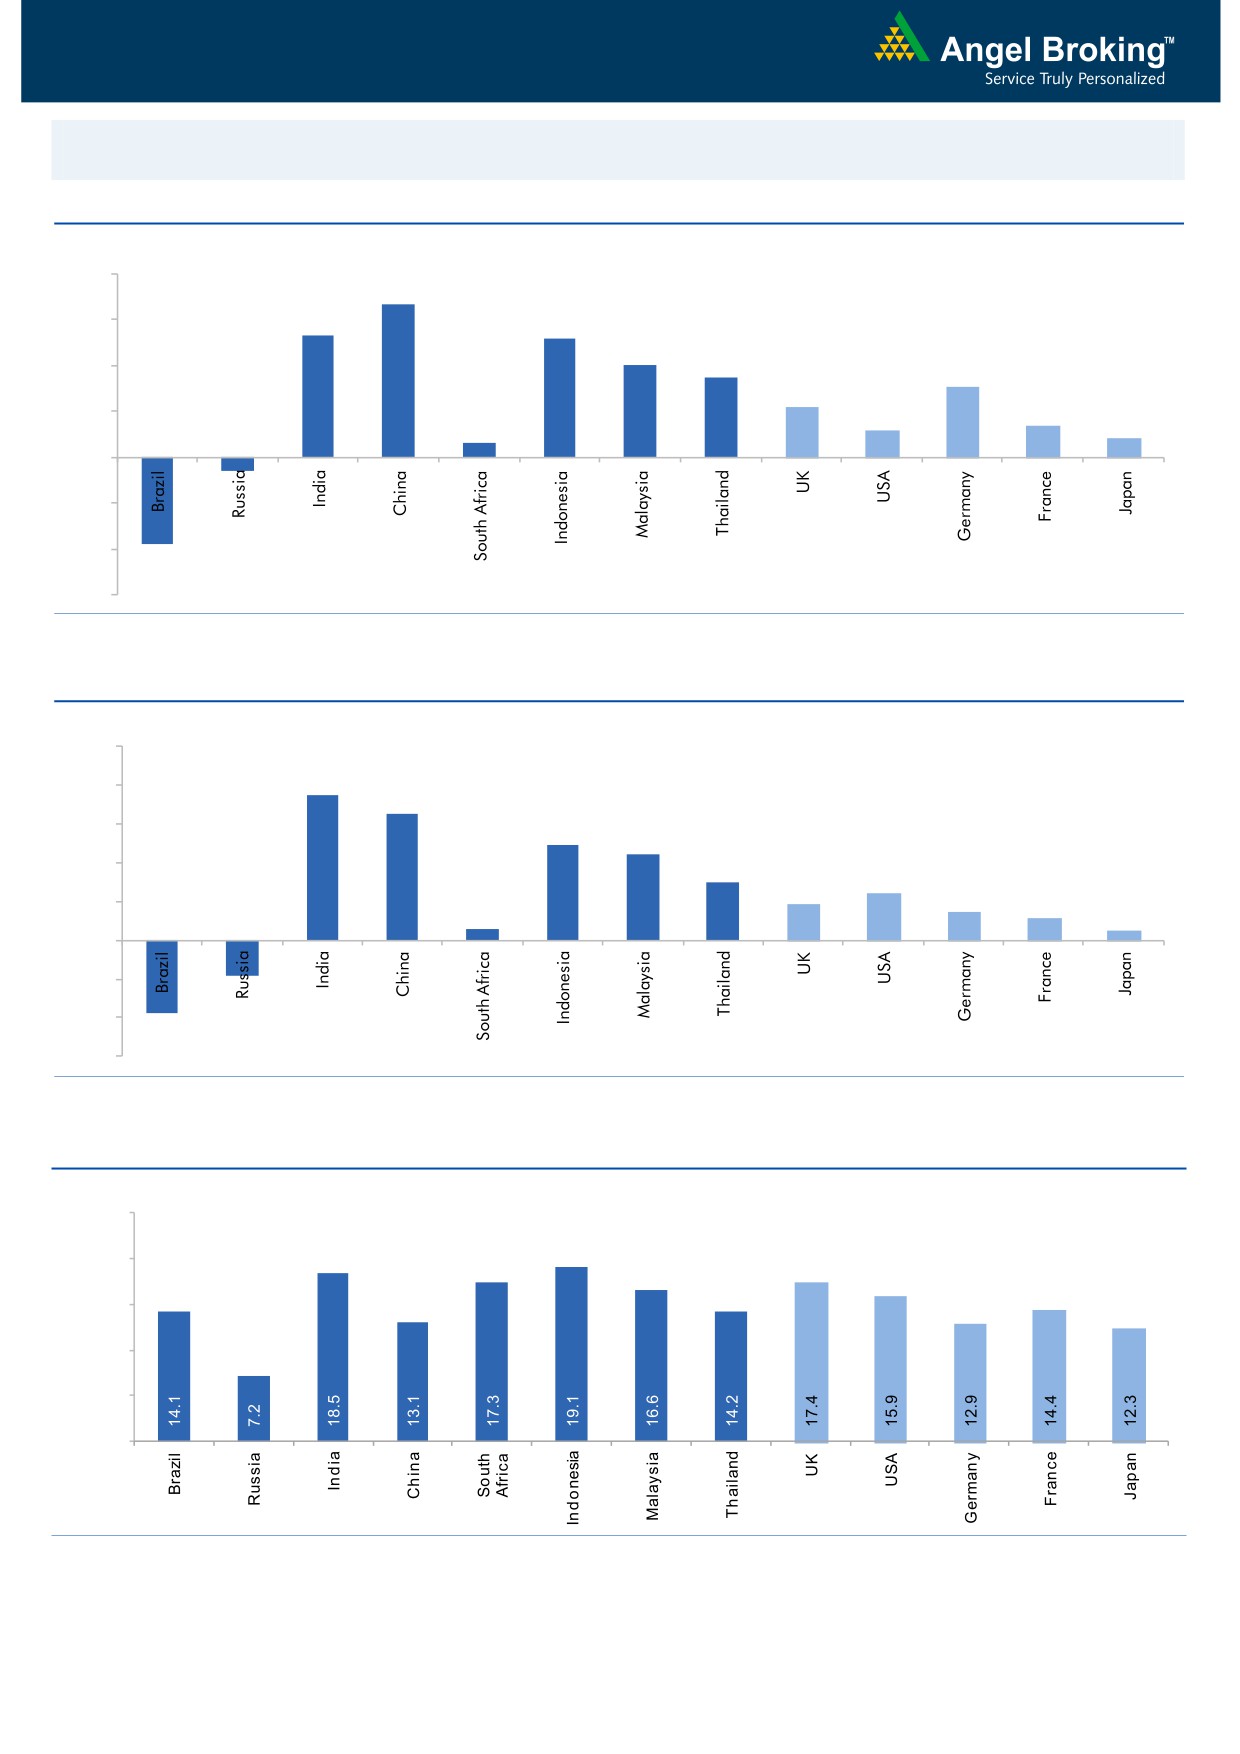
Global watch
Exhibit 1: Latest quarterly GDP Growth (%, yoy) across select developing and developed countries
(%)
8.0
6.7
6.0
5.3
0.6
5.2
4.0
3.5
4.0
3.1
2.2
1.4
2.0
1.2
0.8
-
(2.0)
(0.6)
(4.0)
(3.8)
(6.0)
Source: Bloomberg, Angel Research
Exhibit 2: 2016 GDP Growth projection by IMF (%, yoy) across select developing and developed countries
(%)
10.0
7.5
8.0
6.5
6.0
4.9
4.4
4.0
3.0
2.4
1.9
1.5
2.0
1.1
0.6
0.5
(3.8)
(1.8)
-
(2.0)
(4.0)
(6.0)
Source: IMF, Angel Research
Exhibit 3: One year forward P-E ratio across select developing and developed countries
(x)
25.0
20.0
15.0
10.0
5.0
-
Source: IMF, Angel Research
Market Outlook
September 26, 2016
Exhibit 4: Relative performance of indices across globe
Returns (%)
Country
Name of index
Closing price
1M
3M
1YR
Brazil
Bovespa
58,697
1.2
17.1
24.2
Russia
Micex
2,012
1.4
9.2
22.6
India
Nifty
8,832
2.3
7.4
12.2
China
Shanghai Composite
3,034
(2.5)
5.6
(4.4)
South Africa
Top 40
45,440
(3.0)
(4.2)
2.1
Mexico
Mexbol
47,778
0.2
6.4
12.6
Indonesia
LQ45
933
(0.0)
12.6
24.9
Malaysia
KLCI
1,671
(1.0)
2.9
1.9
Thailand
SET 50
952
(3.5)
4.9
6.4
USA
Dow Jones
18,261
(1.5)
1.4
11.9
UK
FTSE
6,909
0.6
12.6
16.0
Japan
Nikkei
16,754
0.9
3.6
(8.4)
Germany
DAX
10,627
0.0
14.7
12.4
France
CAC
4,489
1.2
12.6
0.7
Source: Bloomberg, Angel Research
Stock Watch
September 26, 2016
Company Name
Reco
CMP
Target
Mkt Cap
Sales ( Čcr )
OPM(%)
EPS (Č)
PER(x)
P/BV(x)
RoE(%)
EV/Sales(x)
(Č)
Price ( Č)
( Č cr )
FY17E FY18E
FY17E
FY18E
FY17E
FY18E
FY17E
FY18E
FY17E
FY18E
FY17E
FY18E
FY17E
FY18E
Agri / Agri Chemical
Rallis
Neutral
222
-
4,326
1,937
2,164
13.3
14.3
9.0
11.0
24.7
20.2
4.3
3.8
18.4
19.8
2.3
2.0
United Phosphorus
Neutral
693
-
35,142
15,176
17,604
18.5
18.5
37.4
44.6
18.5
15.5
3.6
3.0
21.4
21.2
2.4
2.0
Auto & Auto Ancillary
Ashok Leyland
Buy
83
111
23,578
22,407
26,022
10.6
10.6
5.2
6.4
15.9
12.9
3.6
3.0
23.6
24.7
1.1
1.0
Bajaj Auto
Neutral
2,927
-
84,686
25,093
27,891
19.5
19.2
143.9
162.5
20.3
18.0
5.7
4.9
30.3
29.4
3.1
2.7
Bharat Forge
Neutral
946
-
22,011
7,726
8,713
20.5
21.2
35.3
42.7
26.8
22.1
5.0
4.5
18.9
20.1
2.9
2.5
Eicher Motors
Neutral
24,853
-
67,504
16,583
20,447
17.5
18.0
598.0
745.2
41.6
33.4
14.2
10.8
41.2
38.3
3.9
3.1
Gabriel India
Neutral
118
-
1,701
1,544
1,715
9.0
9.3
5.4
6.3
21.9
18.8
4.1
3.7
18.9
19.5
1.1
0.9
Hero Motocorp
Neutral
3,532
-
70,525
31,253
35,198
15.3
15.0
172.3
192.1
20.5
18.4
7.5
6.4
38.9
37.0
2.1
1.9
Jamna Auto Industries Neutral
226
-
1,806
1,486
1,620
9.8
9.9
15.0
17.2
15.1
13.1
3.3
2.8
21.8
21.3
1.3
1.2
L G Balakrishnan & Bros Neutral
575
-
902
1,302
1,432
11.6
11.9
43.7
53.0
13.2
10.8
1.9
1.7
13.8
14.2
0.8
0.7
Mahindra and Mahindra Neutral
1,410
-
87,549
46,534
53,077
11.6
11.7
67.3
78.1
20.9
18.1
3.4
3.0
15.4
15.8
1.9
1.6
Maruti
Neutral
5,602
-
169,231
69,186
82,217
14.7
14.4
198.5
241.4
28.2
23.2
5.5
4.5
20.2
20.0
2.1
1.7
Minda Industries
Neutral
291
-
2,310
2,728
3,042
9.0
9.1
68.2
86.2
4.3
3.4
1.0
0.8
23.8
24.3
0.9
0.8
Motherson Sumi
Neutral
319
-
44,747
45,896
53,687
7.8
8.3
13.0
16.1
24.5
19.8
7.9
6.3
34.7
35.4
1.0
0.9
Rane Brake Lining
Neutral
1,269
-
1,004
511
562
11.3
11.5
28.1
30.9
45.2
41.1
6.9
6.3
15.3
15.0
2.1
1.9
Setco Automotive
Neutral
45
-
595
741
837
13.0
13.0
15.2
17.0
2.9
2.6
0.5
0.4
15.8
16.3
1.2
1.1
Tata Motors
Neutral
553
-
159,763
300,209
338,549
8.9
8.4
42.7
54.3
13.0
10.2
2.1
1.8
15.6
17.2
0.6
0.6
TVS Motor
Neutral
350
-
16,649
13,390
15,948
6.9
7.1
12.8
16.5
27.5
21.2
6.8
5.4
26.3
27.2
1.3
1.1
Amara Raja Batteries
Accumulate
1,022
1,174
17,457
5,429
6,471
17.5
17.6
35.3
43.5
29.0
23.5
6.6
5.4
25.3
24.8
3.1
2.5
Exide Industries
Neutral
193
-
16,397
7,439
8,307
15.0
15.0
8.1
9.3
23.8
20.7
3.3
3.0
14.3
16.7
1.8
1.6
Apollo Tyres
Neutral
220
-
11,221
12,877
14,504
14.3
13.9
21.4
23.0
10.3
9.6
1.6
1.4
16.4
15.2
1.0
1.0
Ceat
Neutral
1,183
-
4,785
7,524
8,624
13.0
12.7
131.1
144.3
9.0
8.2
1.7
1.4
19.8
18.6
0.7
0.6
JK Tyres
Neutral
145
-
3,282
7,455
8,056
15.0
15.0
21.8
24.5
6.6
5.9
1.4
1.1
22.8
21.3
0.6
0.5
Swaraj Engines
Neutral
1,186
-
1,474
660
810
15.2
16.4
54.5
72.8
21.8
16.3
6.8
6.2
31.5
39.2
2.1
1.6
Subros
Neutral
130
-
778
1,488
1,681
11.7
11.9
6.4
7.2
20.3
18.1
2.1
1.9
10.8
11.4
0.8
0.6
Indag Rubber
Neutral
178
-
466
286
326
19.8
16.8
11.7
13.3
15.2
13.3
2.6
2.4
17.8
17.1
1.3
1.1
Capital Goods
ACE
Neutral
45
-
440
709
814
4.1
4.6
1.4
2.1
31.8
21.2
1.3
1.2
4.4
6.0
0.8
0.7
BEML
Buy
915
1,157
3,811
3,451
4,055
6.3
9.2
31.4
57.9
29.2
15.8
1.8
1.6
6.3
10.9
1.2
1.0
Bharat Electronics
Accumulate
1,261
1,414
30,272
8,137
9,169
16.8
17.2
58.7
62.5
21.5
20.2
3.3
3.0
44.6
46.3
2.7
2.4
Stock Watch
September 26, 2016
Company Name
Reco
CMP
Target
Mkt Cap
Sales ( Čcr )
OPM(%)
EPS (Č)
PER(x)
P/BV(x)
RoE(%)
EV/Sales(x)
(Č)
Price ( Č)
( Č cr )
FY17E
FY18E
FY17E
FY18E
FY17E
FY18E
FY17E
FY18E
FY17E
FY18E
FY17E
FY18E
FY17E
FY18E
Capital Goods
Voltas
Accumulate
382
407
12,643
6,511
7,514
7.9
8.7
12.9
16.3
29.6
23.4
5.3
4.7
16.7
18.5
1.7
1.4
BGR Energy
Neutral
116
-
839
16,567
33,848
6.0
5.6
7.8
5.9
14.9
19.7
0.9
0.8
4.7
4.2
0.2
0.1
BHEL
Neutral
146
-
35,784
28,797
34,742
-
2.8
2.3
6.9
63.6
21.2
1.1
1.1
1.3
4.8
0.9
0.6
Blue Star
Accumulate
540
578
5,145
4,351
5,024
6.4
7.1
17.2
20.6
31.4
26.2
20.4
17.0
23.1
24.1
1.2
1.1
Crompton Greaves
Neutral
80
-
5,036
5,777
6,120
5.9
7.0
3.3
4.5
24.4
17.9
1.1
1.0
4.4
5.9
0.8
0.7
Greaves Cotton
Neutral
130
-
3,186
1,755
1,881
16.8
16.9
7.8
8.5
16.7
15.4
3.3
3.1
20.6
20.9
1.5
1.4
Inox Wind
Buy
207
286
4,584
5,605
6,267
15.7
16.4
24.8
30.0
8.3
6.9
2.3
1.7
25.9
24.4
0.9
0.7
KEC International
Neutral
127
-
3,265
9,294
10,186
7.9
8.1
9.9
11.9
12.8
10.7
1.9
1.6
15.6
16.3
0.6
0.5
Thermax
Neutral
860
-
10,247
5,421
5,940
7.3
7.3
25.7
30.2
33.5
28.5
4.1
3.7
12.2
13.1
1.8
1.6
VATech Wabag
Buy
551
681
3,006
3,136
3,845
8.9
9.1
26.0
35.9
21.2
15.4
2.7
2.3
13.4
15.9
0.9
0.7
Cement
ACC
Neutral
1,616
-
30,355
11,225
13,172
13.2
16.9
44.5
75.5
36.3
21.4
3.4
3.2
11.2
14.2
2.7
2.3
Ambuja Cements
Neutral
259
-
51,418
9,350
10,979
18.2
22.5
5.8
9.5
44.7
27.3
3.8
3.4
10.2
12.5
5.5
4.7
India Cements
Neutral
150
-
4,615
4,364
4,997
18.5
19.2
7.9
11.3
19.0
13.3
1.4
1.3
8.0
8.5
1.8
1.6
JK Cement
Neutral
824
-
5,761
4,398
5,173
15.5
17.5
31.2
55.5
26.4
14.8
3.2
2.8
12.0
15.5
1.9
1.5
J K Lakshmi Cement
Neutral
480
-
5,649
2,913
3,412
14.5
19.5
7.5
22.5
64.0
21.3
3.9
3.3
12.5
18.0
2.5
2.1
Orient Cement
Neutral
201
-
4,121
2,114
2,558
18.5
20.5
8.1
11.3
24.8
17.8
3.7
3.1
9.0
14.0
2.6
2.0
UltraTech Cement
Neutral
3,964
-
108,776
25,768
30,385
21.0
23.5
111.0
160.0
35.7
24.8
4.6
4.0
13.5
15.8
4.3
3.6
Construction
ITNL
Neutral
102
-
3,367
8,946
10,017
31.0
31.6
8.1
9.1
12.6
11.3
0.5
0.5
4.2
5.0
3.7
3.4
KNR Constructions
Accumulate
725
802
2,040
1,385
1,673
14.7
14.0
41.2
48.5
17.6
15.0
3.3
2.8
14.9
15.2
1.6
1.3
Larsen & Toubro
Accumulate
1,497
1,700
139,503
67,665
77,249
10.7
11.5
57.3
71.2
26.1
21.0
2.4
2.3
12.6
14.3
2.2
1.9
Gujarat Pipavav Port
Neutral
172
-
8,303
705
788
52.2
51.7
5.0
5.6
34.4
30.7
3.4
3.0
11.2
11.2
11.4
9.7
Nagarjuna Const.
Neutral
87
-
4,817
8,842
9,775
9.1
8.8
5.3
6.4
16.4
13.5
1.3
1.2
8.2
9.1
0.7
0.6
PNC Infratech
Buy
120
143
3,078
2,350
2,904
13.1
13.2
9.0
8.8
13.3
13.6
0.5
0.4
15.9
13.9
1.4
1.2
Simplex Infra
Neutral
339
-
1,675
6,829
7,954
10.5
10.5
31.4
37.4
10.8
9.1
1.1
1.0
9.9
13.4
0.7
0.6
Power Mech Projects
Neutral
496
-
729
1,801
2,219
12.7
14.6
72.1
113.9
6.9
4.4
1.3
1.1
16.8
11.9
0.4
0.3
Sadbhav Engineering
Neutral
290
-
4,967
3,598
4,140
10.3
10.6
9.0
11.9
32.2
24.3
3.4
3.0
9.9
11.9
1.7
1.4
NBCC
Neutral
254
-
15,225
7,428
9,549
7.9
8.6
8.2
11.0
31.0
23.1
1.5
1.2
28.2
28.7
1.8
1.3
MEP Infra
Neutral
47
-
767
1,877
1,943
30.6
29.8
3.0
4.2
15.7
11.2
7.6
5.1
0.6
0.6
1.8
1.6
SIPL
Neutral
114
-
4,008
1,036
1,252
65.5
66.2
(8.4)
(5.6)
4.3
4.9
(22.8)
(15.9)
12.1
10.1
Stock Watch
September 26, 2016
Company Name
Reco
CMP
Target
Mkt Cap
Sales ( Čcr )
OPM(%)
EPS (Č)
PER(x)
P/BV(x)
RoE(%)
EV/Sales(x)
(Č)
Price ( Č)
( Č cr )
FY17E
FY18E
FY17E
FY18E
FY17E
FY18E
FY17E
FY18E
FY17E
FY18E
FY17E
FY18E
FY17E
FY18E
Construction
Engineers India
Neutral
256
-
8,636
1,725
1,935
16.0
19.1
11.4
13.9
22.5
18.4
3.1
3.0
13.4
15.3
3.9
3.5
Financials
Axis Bank
Neutral
557
-
133,038
58,081
66,459
3.5
3.5
32.4
44.6
17.2
12.5
2.3
2.0
13.6
16.5
-
-
Bank of Baroda
Neutral
169
-
38,963
19,980
23,178
1.8
1.8
11.5
17.3
14.7
9.8
1.7
1.4
8.3
10.1
-
-
Canara Bank
Neutral
303
-
16,425
15,225
16,836
1.8
1.8
14.5
28.0
20.9
10.8
1.4
1.2
5.8
8.5
-
-
Dewan Housing Finance Accumulate
293
325
8,542
2,225
2,688
2.9
2.9
29.7
34.6
9.9
8.5
1.6
1.4
16.1
16.8
-
-
Equitas Holdings
Buy
181
235
6,082
939
1,281
11.7
11.5
5.8
8.2
31.3
22.1
2.7
2.4
10.9
11.5
-
-
Federal Bank
Neutral
73
-
12,526
9,353
10,623
2.9
2.9
4.4
5.8
16.6
12.6
1.6
1.4
9.5
11.0
-
-
HDFC
Neutral
1,425
-
225,224
11,475
13,450
3.4
3.4
45.3
52.5
31.5
27.1
6.1
5.4
20.2
20.5
-
-
HDFC Bank
Neutral
1,313
-
332,456
46,097
55,433
4.5
4.5
58.4
68.0
22.5
19.3
3.9
3.3
18.8
18.6
-
-
ICICI Bank
Neutral
272
-
158,104
39,029
45,903
3.3
3.3
16.7
16.3
16.3
16.7
2.0
1.8
10.1
12.4
-
-
LIC Housing Finance
Neutral
573
-
28,937
3,712
4,293
2.6
2.5
39.0
46.0
14.7
12.5
2.8
2.4
19.9
20.1
-
-
Punjab Natl.Bank
Neutral
139
-
27,363
23,532
23,595
2.3
2.4
6.8
12.6
20.5
11.1
3.2
2.3
3.3
6.5
-
-
RBL Bank
Accumulate
303
325
11,216
1,783
2,309
2.6
2.6
12.7
16.4
23.9
18.5
2.6
2.3
12.8
13.3
-
-
South Ind.Bank
Neutral
23
-
3,106
6,435
7,578
2.5
2.5
2.7
3.1
8.5
7.4
1.1
0.9
10.1
11.2
-
-
St Bk of India
Neutral
254
-
197,485
88,650
98,335
2.6
2.6
13.5
18.8
18.8
13.5
1.8
1.6
7.0
8.5
-
-
Union Bank
Neutral
145
-
9,985
13,450
14,925
2.3
2.3
25.5
34.5
5.7
4.2
0.8
0.7
7.5
10.2
-
-
Yes Bank
Neutral
1,232
-
51,884
8,978
11,281
3.3
3.4
74.0
90.0
16.7
13.7
3.2
2.7
17.0
17.2
-
-
FMCG
Asian Paints
Neutral
1,189
-
114,082
17,128
18,978
16.8
16.4
19.1
20.7
62.3
57.5
21.7
20.4
34.8
35.5
6.6
5.9
Britannia
Neutral
3,417
-
40,992
9,795
11,040
14.6
14.9
80.3
94.0
42.6
36.4
17.5
13.5
41.2
-
4.1
3.5
Colgate
Neutral
979
-
26,618
4,605
5,149
23.4
23.4
23.8
26.9
41.1
36.4
22.8
17.8
64.8
66.8
5.7
5.1
Dabur India
Neutral
283
-
49,731
8,315
9,405
19.8
20.7
8.1
9.2
34.9
30.7
9.7
8.1
31.6
31.0
5.6
4.9
GlaxoSmith Con*
Neutral
6,202
-
26,084
4,350
4,823
21.2
21.4
179.2
196.5
34.6
31.6
9.2
7.8
27.1
26.8
5.4
4.8
Godrej Consumer
Neutral
1,583
-
53,895
10,235
11,428
18.4
18.6
41.1
44.2
38.5
35.8
8.5
7.2
24.9
24.8
5.3
4.7
HUL
Neutral
910
-
197,011
35,252
38,495
17.6
17.4
20.4
21.9
44.6
41.6
36.6
32.1
82.2
77.3
5.4
4.9
ITC
Accumulate
254
283
306,418
40,059
44,439
39.0
39.2
9.1
10.1
27.9
25.1
7.6
6.7
27.2
26.5
7.1
6.4
Marico
Neutral
285
-
36,705
6,430
7,349
18.8
19.5
6.4
7.7
44.5
37.0
13.4
11.3
33.2
32.5
5.5
4.8
Nestle*
Neutral
6,457
-
62,253
10,073
11,807
20.7
21.5
124.8
154.2
51.7
41.9
21.2
19.1
34.8
36.7
6.0
5.1
Tata Global
Neutral
142
-
8,987
8,675
9,088
9.8
9.8
7.4
8.2
19.2
17.4
2.2
2.1
7.9
8.1
1.0
0.9
Procter & Gamble
Accumulate
6,900
7,369
22,398
2,939
3,342
23.2
23.0
146.2
163.7
47.2
42.2
105.7
101.3
25.3
23.5
7.2
6.2
Hygiene
Stock Watch
September 26, 2016
Company Name
Reco
CMP
Target
Mkt Cap
Sales ( Čcr )
OPM(%)
EPS (Č)
PER(x)
P/BV(x)
RoE(%)
EV/Sales(x)
(Č)
Price ( Č)
( Č cr )
FY17E FY18E
FY17E
FY18E
FY17E
FY18E
FY17E
FY18E
FY17E
FY18E
FY17E
FY18E
FY17E
FY18E
IT
HCL Tech^
Buy
798
1,000
112,550
49,242
57,168
20.5
20.5
55.7
64.1
14.3
12.5
2.9
2.2
20.3
17.9
2.1
1.7
Infosys
Buy
1,043
1,370
239,571
69,934
79,025
27.5
27.5
64.8
72.0
16.1
14.5
3.6
3.2
22.0
22.3
2.9
2.5
TCS
Buy
2,397
3,004
472,371
121,684
136,286
27.3
27.3
135.0
150.1
17.8
16.0
5.9
5.4
33.2
33.9
3.7
3.2
Tech Mahindra
Buy
454
700
44,118
30,347
33,685
17.0
17.0
37.5
41.3
12.1
11.0
2.6
2.3
21.8
20.7
1.2
1.0
Wipro
Buy
480
680
116,724
51,631
55,822
21.7
17.9
35.9
36.9
13.4
13.0
2.8
2.6
19.0
18.1
2.0
1.7
Media
D B Corp
Neutral
400
-
7,350
2,297
2,590
27.4
28.2
21.0
23.4
19.1
17.1
4.4
3.9
23.7
23.1
3.0
2.6
HT Media
Neutral
83
-
1,921
2,693
2,991
12.6
12.9
7.9
9.0
10.5
9.2
0.9
0.8
7.8
8.3
0.3
0.2
Jagran Prakashan
Buy
189
225
6,166
2,355
2,635
28.0
28.0
10.8
12.5
17.5
15.1
3.8
3.3
21.7
21.7
2.6
2.3
Sun TV Network
Neutral
497
-
19,582
2,850
3,265
70.1
71.0
26.2
30.4
19.0
16.4
4.9
4.3
24.3
25.6
6.5
5.5
Hindustan Media
Neutral
285
-
2,092
1,016
1,138
24.3
25.2
27.3
30.1
10.4
9.5
2.0
1.8
16.2
15.8
1.4
1.2
Ventures
TV Today Network
Buy
312
363
1,864
637
743
27.5
27.5
18.4
21.4
17.0
14.6
3.0
2.5
17.4
17.2
2.5
2.1
Metals & Mining
Coal India
Neutral
329
-
207,650
84,638
94,297
21.4
22.3
24.5
27.1
13.4
12.1
5.6
5.3
42.6
46.0
2.0
1.8
Hind. Zinc
Neutral
227
-
95,788
14,252
18,465
55.9
48.3
15.8
21.5
14.4
10.5
2.3
2.0
17.0
20.7
6.7
5.2
Hindalco
Neutral
154
-
31,801
107,899
112,095
7.4
8.2
9.2
13.0
16.7
11.9
0.8
0.8
4.8
6.6
0.8
0.8
JSW Steel
Neutral
1,759
-
42,523
53,201
58,779
16.1
16.2
130.6
153.7
13.5
11.5
1.8
1.6
14.0
14.4
1.6
1.4
NMDC
Neutral
105
-
41,709
6,643
7,284
44.4
47.7
7.1
7.7
14.8
13.7
1.3
1.3
8.8
9.2
4.0
3.6
SAIL
Neutral
49
-
20,155
47,528
53,738
(0.7)
2.1
(1.9)
2.6
18.8
0.5
0.5
(1.6)
3.9
1.3
1.2
Vedanta
Neutral
170
-
50,518
71,744
81,944
19.2
21.7
13.4
20.1
12.7
8.5
1.1
1.0
8.4
11.3
1.1
0.8
Tata Steel
Neutral
372
-
36,120
121,374
121,856
7.2
8.4
18.6
34.3
20.0
10.8
1.3
1.1
6.1
10.1
0.9
0.9
Oil & Gas
Cairn India
Neutral
197
-
36,907
9,127
10,632
4.3
20.6
8.8
11.7
22.4
16.8
0.7
0.7
3.3
4.2
5.5
4.6
GAIL
Neutral
387
-
49,027
56,220
65,198
9.3
10.1
27.1
33.3
14.3
11.6
1.3
1.2
9.3
10.7
1.1
0.9
ONGC
Neutral
261
-
222,871
137,222
152,563
15.0
21.8
19.5
24.1
13.4
10.8
1.1
1.1
8.5
10.1
1.9
1.7
Indian Oil Corp
Neutral
583
-
141,623
373,359
428,656
5.9
5.5
54.0
59.3
10.8
9.8
1.7
1.5
16.0
15.6
0.5
0.5
Reliance Industries
Neutral
1,103
-
357,625
301,963
358,039
12.1
12.6
87.7
101.7
12.6
10.9
1.3
1.2
10.7
11.3
1.7
1.4
Pharmaceuticals
Alembic Pharma
Neutral
678
-
12,777
3,483
4,083
20.2
21.4
24.3
30.4
27.9
22.3
6.4
5.1
25.5
25.3
3.6
3.0
Aurobindo Pharma
Neutral
842
-
49,298
15,720
18,078
23.7
23.7
41.4
47.3
20.4
17.8
5.3
4.1
29.6
26.1
3.4
2.9
Sanofi India*
Neutral
4,283
-
9,863
2,357
2,692
17.3
17.3
153.5
169.2
27.9
25.3
4.7
3.8
25.8
28.4
3.9
3.2
Cadila Healthcare
Neutral
395
-
40,433
11,126
13,148
22.0
22.0
17.1
20.0
23.1
19.8
5.9
4.7
28.8
26.6
3.6
3.0
Cipla
Sell
611
490
49,110
15,378
18,089
17.4
18.4
21.6
27.2
28.3
22.5
3.7
3.2
13.7
15.2
3.4
2.8
Stock Watch
September 26, 2016
Company Name
Reco
CMP
Target
Mkt Cap
Sales ( Čcr )
OPM(%)
EPS (Č)
PER(x)
P/BV(x)
RoE(%)
EV/Sales(x)
(Č)
Price ( Č)
( Č cr )
FY17E FY18E
FY17E
FY18E
FY17E
FY18E
FY17E
FY18E
FY17E
FY18E
FY17E
FY18E
FY17E
FY18E
Pharmaceuticals
Dr Reddy's
Neutral
3,181
-
52,710
16,043
18,119
23.1
24.7
126.0
157.8
25.3
20.2
3.7
3.2
15.7
17.1
3.2
2.8
Dishman Pharma
Sell
210
45
3,390
1,718
1,890
22.7
22.8
9.5
11.3
22.1
18.6
2.1
1.9
10.1
10.9
2.4
2.1
GSK Pharma*
Neutral
2,801
-
23,727
3,528
3,811
16.6
18.8
51.8
59.4
54.1
47.2
14.5
14.4
26.3
30.6
6.5
6.1
Indoco Remedies
Sell
341
225
3,143
1,112
1,289
18.2
18.2
13.2
15.6
25.8
21.9
4.6
3.9
19.2
19.2
2.9
2.5
Ipca labs
Neutral
598
-
7,543
3,303
3,799
15.3
15.3
17.3
19.7
34.6
30.4
3.0
2.8
9.1
9.4
2.4
2.1
Lupin
Buy
1,489
1,809
67,119
15,912
18,644
26.4
26.7
58.1
69.3
25.6
21.5
5.0
4.1
21.4
20.9
4.3
3.5
Sun Pharma
Buy
780
944
187,746
31,129
35,258
30.0
30.9
28.0
32.8
27.9
23.8
4.3
3.6
18.7
18.9
5.6
4.8
Power
Tata Power
Neutral
76
-
20,447
36,916
39,557
17.4
27.1
5.1
6.3
14.8
12.0
1.3
1.2
9.0
10.3
1.6
1.4
NTPC
Neutral
157
-
129,371
86,605
95,545
17.5
20.8
11.8
13.4
13.3
11.7
1.4
1.3
10.5
11.1
2.8
2.8
Power Grid
Neutral
176
-
91,971
25,763
29,762
74.3
73.1
14.8
17.3
11.9
10.2
1.9
1.6
16.9
17.5
7.8
7.5
Real Estate
MLIFE
Buy
445
522
1,826
1,152
1,300
22.7
24.6
29.9
35.8
14.9
12.4
1.1
1.0
7.6
8.6
2.3
1.9
Telecom
Bharti Airtel
Neutral
327
-
130,895
105,086
114,808
34.5
34.7
12.2
16.4
26.8
20.0
1.8
1.7
6.8
8.4
2.2
1.9
Idea Cellular
Neutral
82
-
29,689
40,133
43,731
37.2
37.1
6.4
6.5
12.9
12.7
1.1
1.0
8.2
7.6
1.8
1.5
zOthers
Abbott India
Neutral
4,765
-
10,124
3,153
3,583
14.1
14.4
152.2
182.7
31.3
26.1
153.7
131.3
25.6
26.1
2.9
2.5
Bajaj Electricals
Accumulate
275
306
2,775
5,099
5,805
5.6
5.9
11.4
14.6
24.2
18.8
3.2
2.9
13.4
15.1
0.5
0.5
Finolex Cables
Neutral
441
-
6,743
2,883
3,115
12.0
12.1
14.2
18.6
31.1
23.7
16.5
14.4
15.8
14.6
2.0
1.8
Goodyear India*
Accumulate
632
684
1,458
1,598
1,704
10.4
10.2
49.4
52.6
12.8
12.0
59.1
51.8
18.2
17.0
0.6
81.2
Hitachi
Neutral
1,462
-
3,975
2,081
2,433
8.8
8.9
33.4
39.9
43.8
36.6
35.3
29.4
22.1
21.4
1.9
1.6
Jyothy Laboratories
Neutral
343
-
6,207
1,440
2,052
11.5
13.0
8.5
10.0
40.3
34.3
9.8
9.0
18.6
19.3
4.6
3.2
Page Industries
Neutral
14,981
-
16,709
2,450
3,124
20.1
17.6
299.0
310.0
50.1
48.3
333.6
254.7
47.1
87.5
6.9
5.4
Relaxo Footwears
Neutral
466
-
5,589
2,085
2,469
9.2
8.2
7.6
8.0
61.6
58.6
23.9
20.4
17.9
18.8
2.8
2.4
Siyaram Silk Mills
Accumulate
1,302
1,469
1,220
1,799
2,040
11.6
11.7
104.9
122.4
12.4
10.6
2.0
1.7
16.4
16.4
0.9
0.8
Styrolution ABS India*
Neutral
599
-
1,053
1,440
1,537
9.2
9.0
40.6
42.6
14.8
14.1
37.7
34.2
12.3
11.6
0.7
0.6
TVS Srichakra
Neutral
2,954
-
2,262
2,304
2,614
13.7
13.8
231.1
266.6
12.8
11.1
331.9
261.3
33.9
29.3
1.0
0.8
HSIL
Neutral
348
-
2,514
2,384
2,515
15.8
16.3
15.3
19.4
22.7
17.9
22.6
19.4
7.8
9.3
1.2
1.1
Kirloskar Engines India
Neutral
344
-
4,967
2,554
2,800
9.9
10.0
10.5
12.1
32.7
28.4
13.7
12.9
10.7
11.7
1.6
1.4
Ltd
M M Forgings
Neutral
420
-
507
546
608
20.4
20.7
41.3
48.7
10.2
8.6
57.5
50.9
16.6
17.0
0.8
0.7
Banco Products (India)
Neutral
220
-
1,572
1,353
1,471
12.3
12.4
14.5
16.3
15.2
13.5
20.9
18.9
14.5
14.6
1.1
118.4
Competent Automobiles Neutral
195
-
120
1,137
1,256
3.1
2.7
28.0
23.6
7.0
8.3
37.5
33.9
14.3
11.5
0.1
0.1
Stock Watch
September 26, 2016
Company Name
Reco
CMP
Target
Mkt Cap
Sales ( Čcr )
OPM(%)
EPS (Č)
PER(x)
P/BV(x)
RoE(%)
EV/Sales(x)
(Č)
Price ( Č)
( Č cr )
FY17E
FY18E
FY17E
FY18E
FY17E
FY18E
FY17E
FY18E
FY17E
FY18E
FY17E
FY18E
FY17E
FY18E
zOthers
Nilkamal
Neutral
1,341
-
2,001
1,995
2,165
10.7
10.4
69.8
80.6
19.2
16.6
76.6
66.6
16.6
16.5
1.0
0.9
Visaka Industries
Neutral
201
-
320
1,051
1,138
10.3
10.4
21.0
23.1
9.6
8.7
25.8
24.2
9.0
9.2
0.6
0.5
Transport Corporation of
Neutral
195
-
1,494
2,671
2,911
8.5
8.8
13.9
15.7
14.1
12.5
1.9
1.7
13.7
13.8
0.7
0.6
India
Elecon Engineering
Neutral
62
-
675
1,482
1,660
13.7
14.5
3.9
5.8
15.9
10.7
3.7
3.4
7.8
10.9
0.8
0.7
Surya Roshni
Neutral
225
-
985
3,342
3,625
7.8
7.5
17.3
19.8
13.0
11.4
24.7
19.8
10.5
10.8
0.6
0.5
MT Educare
Neutral
135
-
539
366
417
17.7
18.2
9.4
10.8
14.5
12.5
3.2
2.8
22.2
22.3
1.4
1.2
Radico Khaitan
Accumulate
112
125
1,483
1,659
1,802
13.0
13.2
6.3
7.4
17.6
15.1
1.5
1.4
8.6
9.3
1.3
1.2
Garware Wall Ropes
Neutral
520
-
1,138
873
938
12.9
13.1
30.9
34.9
16.8
14.9
2.6
2.3
15.7
15.2
1.2
1.1
Wonderla Holidays
Neutral
388
-
2,191
287
355
38.0
40.0
11.3
14.2
34.3
27.3
4.9
4.3
21.4
23.9
7.3
5.9
Linc Pen & Plastics
Neutral
270
-
399
382
420
9.3
9.5
13.5
15.7
20.1
17.2
3.4
3.0
17.1
17.3
1.1
1.0
The Byke Hospitality
Neutral
163
-
652
287
384
20.5
20.5
7.6
10.7
21.4
15.2
4.5
3.6
20.7
23.5
2.3
1.7
Interglobe Aviation
Neutral
921
-
33,201
21,122
26,005
14.5
27.6
110.7
132.1
8.3
7.0
49.8
35.6
168.5
201.1
1.5
1.2
Coffee Day Enterprises
Neutral
229
-
4,716
2,964
3,260
20.5
21.2
4.7
8.0
-
28.6
2.7
2.4
5.5
8.5
2.0
1.8
Ltd
Navneet Education
Neutral
101
-
2,416
1,062
1,147
24.0
24.0
6.1
6.6
16.7
15.3
3.4
3.0
20.6
19.8
2.4
2.2
Navkar Corporation
Buy
193
265
2,750
408
612
42.9
42.3
6.8
11.5
28.5
16.8
2.0
1.8
6.9
10.5
7.6
5.1
UFO Moviez
Neutral
482
-
1,330
619
685
33.2
33.4
30.0
34.9
16.1
13.8
2.2
1.9
13.8
13.9
1.9
1.5
VRL Logistics
Neutral
297
-
2,708
1,902
2,119
16.7
16.6
14.6
16.8
20.4
17.6
4.5
3.9
21.9
22.2
1.5
1.3
Team Lease Serv.
Neutral
1,115
-
1,906
3,229
4,001
1.5
1.8
22.8
32.8
49.0
34.0
5.3
4.5
10.7
13.4
0.5
0.4
S H Kelkar & Co.
Neutral
301
-
4,353
1,036
1,160
15.1
15.0
6.1
7.2
49.3
41.9
5.3
4.8
10.7
11.5
4.1
3.6
Quick Heal
Neutral
231
-
1,618
408
495
27.3
27.0
7.7
8.8
29.8
26.3
2.8
2.8
9.3
10.6
3.1
2.6
Narayana Hrudaya
Neutral
313
-
6,404
1,873
2,166
11.5
11.7
2.6
4.0
118.5
79.0
7.3
6.6
6.1
8.3
3.5
3.0
Manpasand Bever.
Neutral
742
-
3,715
836
1,087
19.6
19.4
16.9
23.8
43.9
31.2
5.3
4.6
12.0
14.8
4.2
3.1
Parag Milk Foods
Neutral
304
-
2,556
1,919
2,231
9.3
9.6
9.5
12.9
32.2
23.5
5.0
4.1
15.5
17.5
1.5
1.3
Mirza International
Buy
93
113
1,122
1,024
1,148
18.0
18.0
6.9
8.0
13.5
11.7
2.3
1.9
16.6
16.2
1.3
1.1
Source: Company, Angel Research; Note: *December year end; #September year end; &October year end; Price as on September 23, 2016
Market Outlook
September 26, 2016
Research Team Tel: 022 - 39357800
DISCLAIMER
Angel Broking Private Limited (hereinafter referred to as “Angel”) is a registered Member of National Stock Exchange of India
Limited,Bombay Stock Exchange Limited and Metropolitan Stock Exchange Limited. It is also registered as a Depository Participant with
CDSL and Portfolio Manager with SEBI. It also has registration with AMFI as a Mutual Fund Distributor. Angel Broking Private Limited is a
registered entity with SEBI for Research Analyst in terms of SEBI (Research Analyst) Regulations, 2014 vide registration number
INH000000164. Angel or its associates has not been debarred/ suspended by SEBI or any other regulatory authority for accessing
/dealing in securities Market. Angel or its associates/analyst has not received any compensation / managed or
co-managed public offering of securities of the company covered by Analyst during the past twelve months.
This document is solely for the personal information of the recipient, and must not be singularly used as the basis of any investment
decision. Nothing in this document should be construed as investment or financial advice. Each recipient of this document should make
such investigations as they deem necessary to arrive at an independent evaluation of an investment in the securities of the companies
referred to in this document (including the merits and risks involved), and should consult their own advisors to determine the merits and
risks of such an investment.
Reports based on technical and derivative analysis center on studying charts of a stock's price movement, outstanding positions and
trading volume, as opposed to focusing on a company's fundamentals and, as such, may not match with a report on a company's
fundamentals. Investors are advised to refer the Fundamental and Technical Research Reports available on our website to evaluate the
contrary view, if any.
The information in this document has been printed on the basis of publicly available information, internal data and other reliable
sources believed to be true, but we do not represent that it is accurate or complete and it should not be relied on as such, as this
document is for general guidance only. Angel Broking Pvt. Limited or any of its affiliates/ group companies shall not be in any way
responsible for any loss or damage that may arise to any person from any inadvertent error in the information contained in this report.
Angel Broking Pvt. Limited has not independently verified all the information contained within this document. Accordingly, we cannot
testify, nor make any representation or warranty, express or implied, to the accuracy, contents or data contained within this document.
While Angel Broking Pvt. Limited endeavors to update on a reasonable basis the information discussed in this material, there may be
regulatory, compliance, or other reasons that prevent us from doing so.
This document is being supplied to you solely for your information, and its contents, information or data may not be reproduced,
redistributed or passed on, directly or indirectly.
Neither Angel Broking Pvt. Limited, nor its directors, employees or affiliates shall be liable for any loss or damage that may arise from
or in connection with the use of this information.